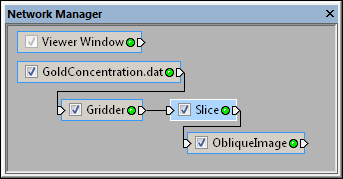
Select the Slice module in the Network Manager
to display its properties in the Property Manager.
The Network | Computational | Slice command adds a Slice module.
The Slice module creates a two-dimensional slice through a three-dimensional input lattice. The plane orientation may be preset to one of the local axis planes or in an arbitrary direction.
Lattice is the input type for the Slice module.
The Slice module creates a uniform 2D lattice. It may be connected to the Graphics Output Modules or the Computational Modules. An Info Module may also be connected to the output node.
Two types of output modules— lattice and geometry— may be connected to the Slice module. To see this in action, click the output connection pad of the Slice module. A context menu appears with two choices: Connect Output Lattice and Connect Output Geometry. Choose the former to connect a module that contains transformed lattice or point data, e.g., BoundingBox. Choose the latter to connect a module that contains output geometry, e.g., ClipPlane. The output geometry consists of the dragger graphics and optional border.
The Slice module properties are described below.
Select the Slice module in the Network Manager
to display its properties in the Property Manager.
The Info module contains the following tabs in the Property Manager:
General

Uncheck the box next to Interpolate to use nearest neighbor
interpolation to create a two-dimensional slice of a
three-dimensional input lattice. Check the Interpolate
box to use trilinear interpolation.
The Input property shows the source to which the module is connected. This option cannot be changed in the Property Manager, but can be changed in the Network Manager by changing the module input.
Check the box next to the Interpolate command to use trilinear interpolation to resample the lattice onto the cutting plane. Uncheck the box next to the Interpolate command to use nearest neighbor interpolation, which applies the closest grid node value on the original grid to the grid node value in the slice.
The X resolution and Y resolution defines the number of nodes in the X and Y direction in the output grid. To change the resolution, highlight the existing value and type the desired value or click the  to increase or decrease the value. Type a value next to X resolution and Y resolution to specify the number of nodes in each direction of the output lattice. Resolution specifies the sampling frequency within the cutting plane. The maximum resolution is 10000 nodes in each direction. Increasing the resolution makes the resulting lattice smoother, but increases the computation time to create the lattice.
Click the  next to Rendering to set the border properties for the slice. Check the box next to Show border to display the border on your map.
To increase or decrease the thickness of the border, highlight the existing value next to Border width (points) and type a new value or click and drag the  to increase or decrease the width of the border line. The line width is displayed in points and ranges from zero to 4 points.
The Border color section specifies the color for the border line. To change the color, click the colored box and choose a new color from the color palette. If the basic colors in the palette do not meet your needs, click Other to create a custom color.
See Also