Voxler can import well data from numerous sources, including from LAS files. Typically the well data (logs) will be imported from one file and the physical location of the well (collars) will be imported from another file. Often, trajectory data indicating the direction of the well trace will also be imported, when the well is not assumed to be vertical.
In order for well traces to be displayed, the WellData module needs to contain valid well paths. For a well to have a valid path, one of the following needs to be true:
The data is imported with azimuth, dip, and measured depth.
The data is imported with directions survey information. A path is then computed automatically.
The data is imported with pre-computed X, Y, and Z values down-the-hole.
Log ASCII Standard LAS files and non-tabular format data files will be imported directly into the WellData module. When well data is in a tabular file format, a Data Source module will be created upon import.
For this example, well collars, trajectory data, and log data are on three tabs of an Excel spreadsheet. Each tab is imported separately, with the following steps.
Click the File | Import command.
In the Import dialog, select the well collar file. For this example, select the SampleWellData.xlsx file from the Samples directory. By default, the Samples directory is located at C:\Program Files\Golden Software\Voxler 4\Samples. Click Open.
In the XLSX Import Options dialog, select the Collars table and click OK.
A Data Source module titled SampleWellData.xlsx - Collars is created.
Specify the following options in the Property Manager:
Change the Output type to Wells
Change the Sheet type to Collars. This step is not required. It simplifies the Property Manager display, showing only the properties applicable to a worksheet containing collar data.
Set Well Name (ID) to Column A: ID
Set Top X (Easting) to Column B: Easting
Set Top Y (Northing) to Column C: Northing
Set Top Z (Elevation) to Column D: Elevation
Set Azimuth to Column E: Azimuth
Set Vertical Direction to Dip
Set Dip to Column F: Dip
Set Total Depth to Column G: Depth
Click the Network | Well | WellData command to create a WellData module.
Verify that the SampleWellData.xlsx - Collars module output is connected to one of the WellData module inputs.
At this point, all you have imported is the top location of the six wells. To import the well trajectories (traces), follow the steps in this section.
Click the File | Import command or click the Add Data button in the Property Manager Inputs page for the WellData module.
In the Import dialog, select the well file. Select the SampleWellData.xlsx file again and click Open.
In the XLSX Import Options dialog, select the Trajectories table and click OK.
A Data Source module titled SampleWellData.xlsx - Trajectories is created.
Specify the following options in the Property Manager:
Change the Output type to Wells
Change the Sheet type to Directional Survey. This step is not required, but it is recommended.
Set Well Name (ID) to Column A: ID
Set Azimuth to Column C: Azimuth
Set Vertical direction to Inclination
Set Inclination to Column D: Inclination
Set Measured Depth to Column B: MD
Connect the SampleWellData.xlsx - Trajectories module output to one of the WellData module inputs.
The information is imported, and the actual X, Y, and Z values for the path of the well are calculated automatically by the program.
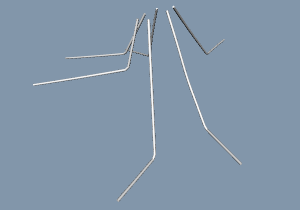
At this point, we can display the wells by clicking the Network | Graphic Output | WellRender command. The well traces are then displayed.
The initial well traces are displayed in the Viewer window.
The well appearance can be altered by importing additional data.
Click on the WellData module in the Network Manager.
Click the File | Import command or click the Add Data button on the Inputs page of the Property Manager.
In the Import dialog, select the well file. Select the SampleWellData.xlsx again and click Open.
In the XLSX Import Options dialog, select the Samples table and click OK.
A Data Source module titled SampleWellData.xlsx - Samples is created.
Specify the following options in the Property Manager:
Change the Output type to Wells
Change the Sheet type to From / To Logs. This step is not required, but it is recommended.
Set Well Name (ID) to Column A: ID
Set From to Column B: From
Set To to Column C: To
Set Log columns to 2
Set Log-1 to Column D: TiO2
Set Log-2 to Column E: MnO
Connect the SampleWellData.xlsx - Samples module output to one of the WellData module inputs.
Once the log data is imported, the well appearance can be modified to display the logs using these steps:
Click on the WellRender module in the Network Manager.
Click on the Interval Data tab in the Property Manager.
Check the box next to Show intervals to add variable width log information.
Change the Interval log to MnO to use the MnO log To Depth and From Depth as the interval definition.
Change the Color method to By log so the colors of the intervals vary with log data.
Set the Color log to MnO.
Change the Colormap to Rainbow to display different colors along the length. The colors are determined by mapping the values in the MnO log to the colors in the Rainbow colormap.
Set the Size method to By log.
Set the Size log to TiO2. The width of the log is now determined by the data in the TiO2 log.
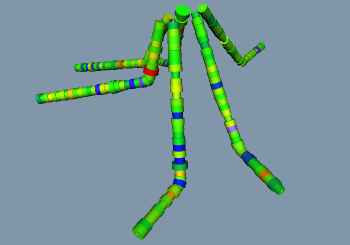
The wells are now displayed as tubes of variable width,
based on the data in the TiO2 log, and color, based on
the data in the MnO log.
See Also