The Network | Graphics Output | Contours command adds a Contours module.
The Contours module generates contour lines for a two-dimensional data set or for slices of a three-dimensional data set. Contour lines represent the boundary between data less than a given level (threshold) and data greater than the level. For three-dimensional data sets, the Contours module creates a planar slice through the lattice and contours the two-dimensional slice. Contour lines are colored by mapping data values to colors through a Colormap.
Contours are calculated by locating points along with the lattice lines where the values are equal to the contour level by using linear interpolation between the lattice nodes. The contour line is drawn by connecting the points with straight line segments. The more dense a lattice is, the more line segments are generated and the smoother the contour lines appear. This method is sometimes called "marching squares."
Contours can be draped over the HeightField by loading the contours from a grid file as a curvilinear lattice.
A Contours module can be exported to different file types with the File | Save Data command, including IV, 3D DXF, and XYZC data files in the following data file formats: CSV, DAT, SLK, TXT, XLS, and XLSX.
Lattice is the input type for the Contours module.
The Contours module creates an output geometry. It may be connected to the Graphics Output Modules. An Info Module may also be connected to the output node.
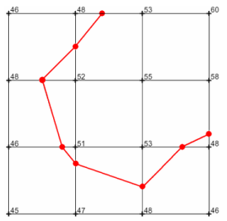
A contour with a value of 50 (shown in
red) is drawn with straight line segments
between points along lattice lines
(shown in black) connecting lattice nodes.
Red dots illustrate the ends of the
straight line segments that
form the contour.
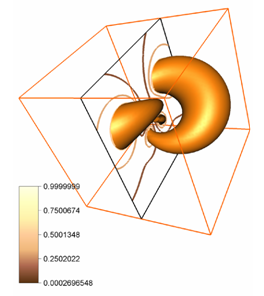
The Contours module contours a slice created
through a three dimensional data set.
The Contours module properties are described below.
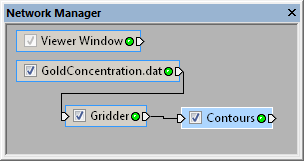
Select the Contours module in
the Network Manager
to display its properties in the Property
Manager.
The Contours module contains the following tabs in the Property Manager:
General

Customize the Contours properties.
The Input property shows the source to which the module is connected. This option cannot be changed in the Property Manager, but can be changed in the Network Manager by changing the module input.
The Input data limits option displays the minimum and maximum value of the selected input component data. If the input data is a three-dimensional lattice, these values are for the entire lattice and not just for the specified two-dimensional cutting plane through the lattice.
The Input component specifies
which of the input components contains the data used to compute the contours
when there is more than one component. When there is not more than one
component in the input lattice, this option is not shown. To change the
Input component, highlight the
existing value and type a new value or click the  to increase or decrease the component value.
The Level method specifies the method to compute the values of the contour levels. Increase the number of contour levels to provide more detail. To change the level method, click on the existing option and select the new value from the list. Available options are Automatic; Min, max, count; Min, max, interval; and Explicit.
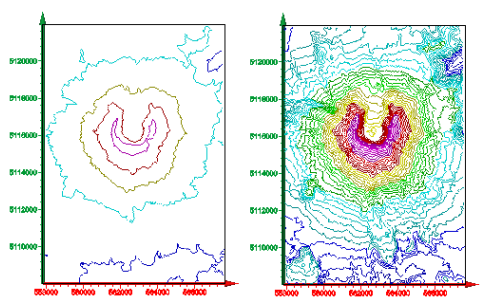
Add more contour levels to define additional details. The default Automatic
method (shown on the left) displays five levels. The Min, max, interval method
(shown on the right) is used to display contours at 50-meter intervals.
Automatic uses the data limits to display the specified number of contour levels. The minimum and maximum levels are offset from the data minimum and maximum by an amount equal to the data range divided by twice the number of levels. When attaching a new Contours module to a lattice, the default number of levels is 5, so the offset is 10% of the data range. When attaching a Contours module to a lattice, the offset depends on the number of levels specified in the Contours module. If the minimum or maximum level values are not present in the specified cutting plane, not all of the specified number of contours are displayed.
For example, the data minimum and maximum for the lattice in helens2.grd are 684 and 2547 and the range is 1863. The default = 186.3. The minimum level is 684 + 186.3 = 870.3. The maximum level is 2547 - 186.3 = 2360.7. To calculate the default contour interval, divide the levels range by the number of levels minus 1, or (2360.7 - 870.3)/4 = 372.6. The resulting value for the five levels are 870.3, 1242.9, 1615.5, 1988.1, and 2360.7.
Min, max, count displays the specified number of contour levels with equal spacing from the specified minimum to the specified maximum values. Use the calculations in the example for the Automatic method to calculate the contour interval and values of the contour levels. If the Minimum level or Maximum level values are not present in the specified cutting plane, not all of the specified number of levels are displayed.
Min, max, interval displays contour levels with the specified interval ranging from specified minimum and maximum. If the Minimum level or Maximum level values are not present in the specified cutting plane, not all of the specified number of levels are displayed.
Explicit allows you to enter a space-separated list of contour levels to be displayed. If a level is outside the data range, it is not displayed.
The Minimum level is the smallest data value to use for displaying a contour line. If the specified Minimum level value is smaller than the minimum value in the lattice slice, no contour is displayed for that level. If the specified value is larger than the maximum value in the lattice slice, no contours are displayed for any of the levels. This option is available for each Level method, except for the Explicit option. To change the Minimum level value, highlight the existing value and type a new value. The option is for information only when the Level method is set to Automatic.
The Maximum level is the largest data value to use for displaying a contour line. If the specified value is larger than the maximum value in the lattice slice, no contour is displayed for that level. If the specified value is smaller than the minimum value in the lattice slice, none of the levels are displayed. This option is available for each Level method, except for the Explicit option. To change the Minimum level value, highlight the existing value and type a new value. The option is for information only when the Level method is set to Automatic.
The Number of levels is the
number of contour levels. To change the number of levels, highlight the
existing value and type a new value or click the
to increase or decrease the number of levels. If the minimum and maximum
level values are not present in the specified cutting
plane, there are fewer contours displayed than the number specified
by the Number of levels. This
option is available when the Level method
is set to Automatic or Min, max, count.
The Level interval is the contour interval or the difference between the values of two adjacent contours. To change the level interval, highlight the existing value and type a new value. If the Level interval is larger than the range from Minimum level to Maximum level, no contour lines are shown. This option is only available when the Level method is set to Min, max, interval.
The Level values option controls the exact values that should display contour lines. If no values are typed next to Levels values, no lines are displayed on the contour plot. To set the Level values, click in the box next to Level values, and type a number. For multiple values, include a space between contour levels. For example, to display contours with a logarithmic interval, enter the following:
0.1 0.5 1 5 10 50 100 500 1000 5000
The Line width (points) is
the thickness of the contour lines (in points). To change the line width,
highlight the existing value and type a new value or drag the  to increase or decrease the line width. A line width of zero is equal
to one pixel. The Line width (points)
values vary between zero and 4.
to increase or decrease the line width. A line width of zero is equal
to one pixel. The Line width (points)
values vary between zero and 4.
The Colormap maps scalar
values to colors. To change the colormap used by the contours, click the
existing color bar to the right of the Colormap
command to select a different colormap from the list. Click on the desired
colormap and the contour map updates. Alternatively, click the  button to open the Colormap Editor dialog.
The Colormap Editor dialog
allows you to create a custom colormap and to change the mapping
of color to data values. By default, the minimum and maximum values are
mapped to the data minimum and maximum, and a smaller range may not be
present in the cutting plane.
button to open the Colormap Editor dialog.
The Colormap Editor dialog
allows you to create a custom colormap and to change the mapping
of color to data values. By default, the minimum and maximum values are
mapped to the data minimum and maximum, and a smaller range may not be
present in the cutting plane.
Check the box next to the Show border command to show or hide the border around the edge of the contour plane.
The Border width (points) controls
the thickness of the border (in points). To change the line width, highlight
the existing value and type a new value or drag the
to increase or decrease the line width. A line width of zero is equal
to one pixel. The Border width (points)
values vary between zero and 4.
The Border color option controls the color of the border line. Click the color next to Border color to open the color palette. Click on the desired new color to update the map. Alternatively, click the Other button at the bottom of the list to open the Colors dialog, where you can select a custom color.
See Also