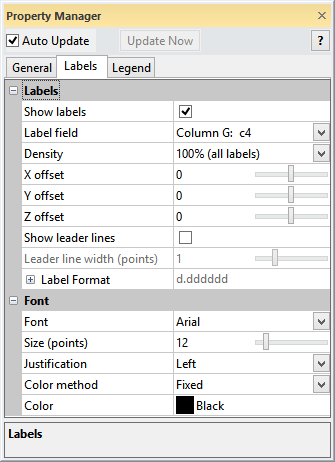
The ScatterPlot module Labels page displays the options for showing labels for scatter plot points. To open the Labels page, click on the ScatterPlot module in the Network Manager. In the Property Manager, click on the Labels tab.
Edit the label properties on the Labels tab for a ScatterPlot.
Check the box next to the Show labels command to display labels at each point on the ScatterPlot. The field to use to display labels is set in the Label field option.
The Label field is the value displayed as the label on the ScatterPlot. To change the label displayed, click on the existing Label field option and select the desired option from the list. Available options are X, Y, Z, XYZ, and all Label columns specified in the Data Source properties. A Component column can be specified as a Label column if you wish to plot the Component value as a label. If multiple label columns are specified in the Data Source module properties, each label column will be listed as a separate option. When a label column is selected, the value in the column is displayed next to the symbol. When X, Y, Z, or XYZ is selected, the location value is displayed. For X, Y, and Z, only the selected value is displayed. When XYZ is selected, the labels are displayed as X, Y, Z.
The Density determines the number of labels to plot as a percentage of the total number of points displayed on the ScatterPlot. Due to this relationship, the percentage of labels compared to the number of data points in the data file is the ScatterPlot point Density (set on the General page) times the label Density (e.g. 50% point density x 50% label density = 25%). Also because of this, labels are only plotted for visible ScatterPlot points.
The possible Density values are 100% (all labels), 50% (every other label), 33% (every 3rd label), 25% (every 4th label), 20% (every 5th label), 10% (every 10th label), 5% (every 20th label) and 1% (every 100th label). To change the density of plotted labels, click on the existing option and select the desired value from the list.
The X offset moves the screen
position of the label away from the symbol along the X axis. Values are
in pixels and range from -100 pixels to +100 pixels. From the top view
for example, a negative value moves the label to the left, and a positive
value moves the label to the right. The label stays aligned with the screen
regardless of how it is moved. To change the offset, highlight the existing
value and type a new value or click and drag the  to the desired value.
The Y offset moves the screen
position of the label away from the symbol along the Y axis. Values are
in pixels and range from -100 pixels to +100 pixels. From the top view
for example, a negative value moves the label below the symbol, and a
positive value moves the label above the symbol. The label stays aligned
with the screen regardless of how it is moved. To change the offset, highlight
the existing value and type a new value or click and drag the
to the desired value.
The Z offset moves the screen
position of the label away from the symbol along the Z axis. Values are
in pixels and range from -100 pixels to +100 pixels. From the top view
for example, a negative value moves the label behind the symbol, and a
positive value moves the label in front of the symbol. The label stays
aligned with the screen regardless of how it is moved. To change the offset,
highlight the existing value and type a new value or click and drag the
to the desired value.
Check the box next to the Show leader lines option to display lines connecting the label and ScatterPlot symbol.
Use the Leader line width (points)
option to scale the thickness of the line that connects the point to the
label. Values are in points and range from zero to four points. To change
the line thickness, highlight the existing value and type a new one, or
drag the to the desired value.
Click the  next to Label Format to open
the label format section.
The Type, Significant
digits, Prefix, and Postfix
can be set for the ScatterPlot
labels.
next to Label Format to open
the label format section.
The Type, Significant
digits, Prefix, and Postfix
can be set for the ScatterPlot
labels.
The Font option sets the font used for writing the labels. All available TrueType fonts are listed as options. To change the font, click the current font name and select the desired font name from the list.
The Size (points) section sets
the size of the labels in points. Values range from 4 to 288 points. The
larger the value, the larger the text appears on the screen. To change
the value, highlight the existing value and type a new value or click
and drag the to the desired
size.
Choose Left, Right, or Center justification for the label. The justification is relative to the three-dimensional anchor point. Left anchors the left edge of the text to the anchor point, Right anchors the right edge of the text to the anchor point, and Center anchors the middle of the text to the anchor point.
The method used to generate the symbol colors. The color of the symbols may be set to a Fixed color or to By data, which matches a colormap with the component value. To change the Color method, click on the existing option and select the desired option from the list.
When set to Fixed, the Color option becomes available. The Color is the color of the symbol. To change the color, click on the existing color and select the desired color from the list. Alternatively, click the Other box to open the Colors dialog, where you can set custom colors.
When the Color method is set to By data, the Colormap for the symbols is used for the labels.
See Also