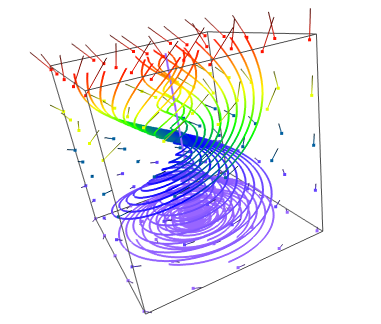
The VectorPlot module output can be
enhanced when used in conjunction
with the StreamLines module.
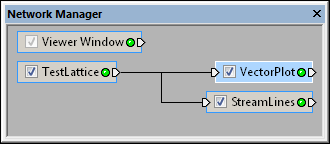
The Network | Graphics Output | VectorPlot command adds a VectorPlot module.
The VectorPlot module displays vectors on a three-dimensional lattice or point set. Care should be used with this visualization technique, as it is easy to add too many vectors and clutter up the display, making it difficult to discern patterns. This module uses the first three components of an input lattice. If the lattice has fewer components, those components are treated as zero values. Arrows are drawn with the base at the node location. It is often useful to combine this module with another module such as StreamLines.
Lattice and point data are input types for the VectorPlot module.
The VectorPlot module creates an output geometry. It may be connected to the Graphics Output Modules. An Info Module may also be connected to the output node.
The VectorPlot module output can
be
enhanced when used in conjunction
with the StreamLines module.
The VectorPlot module properties are described below.
Select the VectorPlot module in
the Network Manager
to display its properties in the Property
Manager.
The VectorPlot module contains the following tabs in the Property Manager:
General

Customize the VectorPlot properties.
The Input data property shows the source data to which the module is connected. This option cannot be changed in the Property Manager, but can be changed in the Network Manager by changing the module input.
The Input scalar data property shows the source scalar data to which the module is connected. This option cannot be changed in the Property Manager, but can be changed in the Network Manager by changing the module input.
The Orientation property allows the vectors to be constrained to a plane in one of the three cardinal directions. Available options are XY plane, XZ plane, YZ plane, or All. All displays vectors from the entire three-dimensional lattice. To change the orientation, click on the existing option and select the desired direction from the list.
The Frequency option indicates
the sampling frequency along each dimension for lattices, or for the entire
data sequence for point sets. For example, if the frequency is 4, then
every fourth vector is displayed. Value should be between 1 and the number
of nodes in each direction in the lattice. The larger the value, the less
vectors are displayed in the Viewer
window. To change the value, highlight the existing value
and type a new value or click and drag the  to increase
or decrease the value.
to increase
or decrease the value.
Choose a Vector style to determine the symbol style used to represent each vector. Choices include Line, Arrow 2, Arrow 4, Arrow cross, Arrow solid, and Fade. To change the vector style, click on the existing vector style name and select the desired option from the list.
The Line style creates a line with no arrowhead. The line color for each line is the same and is based on the lattice component value at that location. The Arrow 2, Arrow 4, Arrow cross, and Arrow solid creates a line with an arrowhead. The color of the line is the same and is based on the lattice component value at that location. The Arrow 2 has 2 lines creating the arrowhead. The Arrow 4 has four lines creating the arrowhead. The Arrow cross has four 3D lines creating the arrowhead. The Arrow solid creates a square pyramid for the arrowhead.
The Fade style creates a line with no arrowhead. The color of the line fades from the specified color or colormap to black.
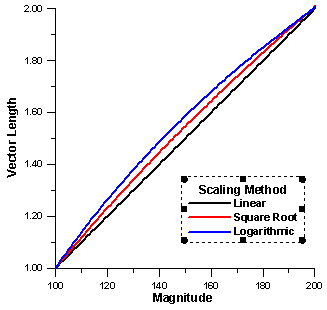
Choose the method used to scale the vector symbols. There are three ways to scale vectors between the minimum and maximum data values: linearly, logarithmically, or by square root. Linear scaling provides a better visual representation of symbols that, for the most part, are scaled in one dimension (such as arrows with varying shaft length). When scaling the arrows in two dimensions (symbol width and shaft length), Square root or Logarithmic scaling displays the arrows more effectively. This is because the symbol size is perceived by the human eye as having an enclosed area, and area is a distance-squared function. To change the scaling method, click on the existing option and select the desired option from the list.
The Min scale is the smallest
size allowed for vectors. The smallest component value is mapped to the
Min scale value.
To change the Min scale, highlight
the existing value and type the desired value or click and drag the to the desired value. Values
can be between zero (no visible vector) and 5. The larger the number,
the larger the vectors that are displayed.
The Max scale is the largest
size allowed for vector. The largest component value is mapped to the
Max scale value.
To change the Max scale, highlight
the existing value and type the desired value or click and drag the to the desired value. Values
can be between zero (no visible vector) and 5. The larger the number,
the larger the vectors that are displayed.
The Arrow scale option sets
the scale factor for the arrowhead portion of the vector symbol. To change
the size of the arrowheads, highlight the existing value and type the
desired value or click and drag the
to increase or decrease the arrowhead size. Values can be between zero
(no arrowhead) and 5. The larger the value, the larger the arrowhead.
The Arrow scale option
is not available when the Vector
style is set to Line
or Fade.
The Base symbol size (points)
sets the radius of the symbol located at the starting point of the vector.
This value is in points and ranges from zero (no symbol) to 48 points.
To change the base symbol size, highlight the existing value and type
a new value or click and drag the to increase
or decrease the size. Symbol color matches the vector color.
The Line width (points) sets
the width of the line to use for the vectors. This value is in points
and ranges from zero to four points. To change the thickness of the vector
lines, highlight the existing value and type a new value or click and
drag the to increase or decrease
the value.
Check the box next to the Reverse orientation command to reverse the orientation of the vectors. The symbol location does not change, but the vector goes in the opposite direction.
Choose the method used to calculate a color for the vectors. Available options are Fixed, Magnitude, and Scalar. To change the color method, click on the existing option and select the desired option from the list.
The Fixed color method sets all of the vectors to the same color. When the Color method is Fixed, the Color option becomes available.
The Magnitude color method sets the color of each vector based on the lattice component value at the vector starting location. When the Color method is set to Magnitude, the Colormap option becomes available.
The Scalar color method requires a second lattice to be connected to the VectorPlot module. When the Color method is set to Scalar, the Colormap and Color component options becomes available. For each vector, the corresponding scalar value is extracted from the connected lattice and is used to look up the color from the Colormap. The same lattice can be specified for both the primary input and the scalar data. To connect a second lattice to the VectorPlot, import the lattice. Once the lattice appears, drag a connection from the lattice to the VectorPlot. Select the Connect Scalar Lattice option in the window that appears.
The Color is the color of the vector. To change the color, click on the existing color and select the desired color from the list. Alternatively, click the Other box to open the Colors dialog, where you can set custom colors.
The Colormap property maps
the vector magnitude to color. Click the color bar next to Colormap
to display the default color combinations. Click the  button to launch the Colormap Editor
dialog.
button to launch the Colormap Editor
dialog.
The Color component is the
component from the Scalar Lattice
to use for interpolating colors. The specified component is then used
with the Colormap to determine
the vector colors. To change the component, highlight the existing value
and type a new value or click the  to increase
or decrease the component number.
to increase
or decrease the component number.
See Also