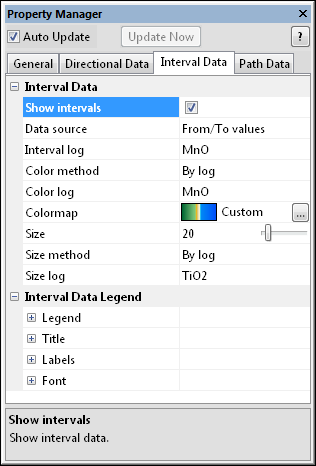
The WellRender module Interval Data page contains the options to display interval log values or from-to data along the well paths. All wells in the WellRender have the same properties applied. To open the Interval Data page, click on the WellRender module in the Network Manager. In the Property Manager, click on the Interval Data tab.
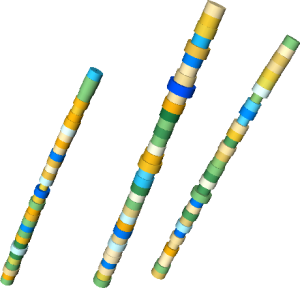
This example shows 3 well traces, with the size
of the well tube determined by interval log data.
The WellRender module contains the following tabs in the Property Manager:
Interval Data
The Interval Data page controls the width of the well
trace, when variable width is desired.
Check the box next to the Show intervals option to turn on the display of variable width well traces.
The Data source is the source for the interval values. Values can be determined from Log values or From/To values. To change the source, click on the existing value and select the desired value from the list.
The Interval log is the source log for determining the intervals. If the Data source is set to Log values, the values in the Interval log are used as depths. So, if the first value is 300, the first interval will be 300 units long. If the Data source is set to From/To values, an interval log with a From Depth and To Depth column needs to be imported. To change the Interval log, click on the existing option and select the desired log from the list.
The Color method is the method used to generate the interval colors. The method may be set to a Fixed color or to By log, which matches a colormap with the Color log. Mapping the Color log through a Colormap can be useful when wanting to highlight some feature of the interval data with changing colors. To change the Color method, click on the existing option and select the desired option from the list.
When set to Fixed, the Color option becomes available. The Color is the color of all of the intervals displayed. To change the color, click on the existing color and select the desired color from the list. Alternatively, click the Other box to open the Colors dialog, where you can set custom colors.
When the Color method is set
to By log, the Colormap
option becomes available. To change the colormap used by the intervals,
click the existing color bar to the right of the Colormap
command to select a different colormap from the list. Click on the desired
colormap and the intervals update. Alternatively, click the  button to open the Colormap
Editor dialog. The Colormap Editor
dialog allows you to create a custom colormap and to change the mapping
of color to data values.
button to open the Colormap
Editor dialog. The Colormap Editor
dialog allows you to create a custom colormap and to change the mapping
of color to data values.
The Color log is the log used to color the intervals when the Color method is set to By log. To change the Color log, click on the existing option and select the desired log from the list.
The Size option controls the
relative width of the well trace for each interval. When the Size
method is set to Fixed,
all disks are the specified Size.
To change the Size, highlight
the existing value and type a new value or click and drag the  to the desired value. Values range between zero and 200. Values are in
points. The Size indicates
the radius of the well trace intervals being drawn.
to the desired value. Values range between zero and 200. Values are in
points. The Size indicates
the radius of the well trace intervals being drawn.
The Size method is the method used to determine the width of the well trace for the intervals. Available options are Fixed and By log. When the Size method is set to Fixed, all intervals appear with a radius specified by the Size value. When set to By log, the Size log option becomes available. The Size log is the log data that is used to size the width of the well trace for each interval. To change the Size method, click on the existing option and select the desired method from the list.
The Size log is the log data that is used to size the width of the well trace for each interval. The smallest value in the log is scaled to a value of 1/2 the Size value. The largest value in the log is scaled to a value of 1.5 times the Size value. The width of the well trace varies linearly between these values. To change the Size log, click on the existing option and select the desired log from the list.
The options in the Interval Data Legend section are discussed on the Legend page.
See Also