2.1 - Creating a Scatter Plot - Tutorial
A scatter plot is a model of point data within a volume of space, optionally
with colors representing data values.
To create a :
Click
on the xyzc1.dat
in the Network Manager to
select it. The selected module is highlighted.
In
the Module Manager, double-click
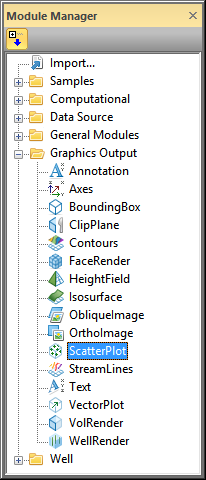
on the ScatterPlot module
name in the Graphics Output
section of the list. Alternatively, right-click on xyzc1.dat
in the Network Manager and
select Graphics Output | ScatterPlot
from the context menu.
A scatter plot is displayed in the Viewer
window and the ScatterPlot module
appears connected to the xyzc1.dat
module in the Network Manager.
In the Module Manager, only
the modules that can be used with the data type are listed if the Show All Modules button is not
selected. The button is selected if it looks like this  and not selected when it looks like this
  . In this
example, we used , so
the main graphics outputs are axes, bounding box, scatter plots, and vector
plots. Other graphics, such as ,
need
as inputs so they are not listed when the button is not selected.

Select ScatterPlot in
the
Graphics Output folder to create
a scatter plot of the data.
Back to Creating Graphics
Output Modules
Next to Adding a Bounding
Box
 and not selected when it looks like this
  . In this
example, we used point data, so
the main graphics outputs are axes, bounding box, scatter plots, and vector
plots. Other graphics, such as isosurfaces,
need lattices
as inputs so they are not listed when the button is not selected.