Click on the ScatterPlot module in the Network Manager.
In the Property Manager, click on the Labels tab.
Check the box next to Show labels to turn on the display of labels for the module.
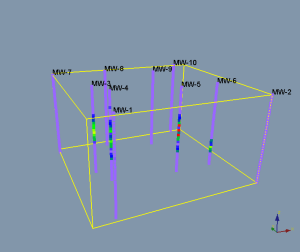
Change the Label field to the desired column. In this case, let's select Column E: ID. The labels are added next to the points that contain information in the label column.
Click
the  next to Font
to open the font properties for the labels.
next to Font
to open the font properties for the labels.
To increase
the size of the labels, click and drag the  next
to Size (points) until the
desired size is shown in the Viewer
window.
next
to Size (points) until the
desired size is shown in the Viewer
window.