Next we will add a bounding box around the input data. A bounding box draws a three-dimensional box around the input data extents.
To draw a bounding box:
1. In the Network Manager, click the xyzc1.dat module.
2. In the Module Manager, double-click BoundingBox under Graphics Output.
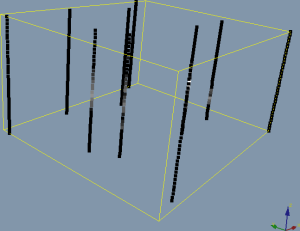
Your scatter plot should look similar to this
after you add the bounding box.
Alternatively, you could have right-clicked the xyzc1.dat module in the Network Manager and selected Graphics Output | BoundingBox from the context menu.
Back to Creating a Scatter Plot
Next to Lesson 3 - Changing Properties