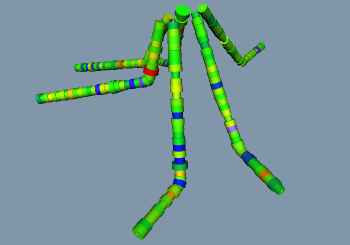
Once the log data is imported, the well appearance can be modified to display the logs using these steps:
Click on the WellRender module in the Network Manager.
Click on the Interval Data tab in the Property Manager.
Check the box next to Show intervals to add variable width log information.
Change the Interval log to Column E: MnO to use the MnO log To Depth and From Depth as the interval definition.
Change the Color method to By log so the colors of the intervals vary with log data.
Set the Color log to Column E: MnO.
Change the Colormap to Rainbow to display different colors along the length. The colors are determined by mapping the values in the MnO log to the colors in the Rainbow colormap.
Set the Size method to By log.
Set the Size log to Column D: TiO2. The width of the log is now determined by the data in the TiO2 log.

The wells are now displayed as tubes of variable
width, based on the data in the TiO2 log.
Back to Importing Well Logs
Next to Advanced Tutorial Introduction or Tutorial Completion