The data held in a Data Source module can be edited in the worksheet window. Changes made in the worksheet window are immediately visible in the Viewer window. In this lesson we will make a few changes in the worksheet and see how it affects the downstream modules.
To view the xyz1.dat module data in the worksheet:
Click on the xyc1.dat module in the Network Manager.
Click the Edit Worksheet button in the Worksheet field of the Property Manager. The module data is opened in a new worksheet window. Notice the document tab displays “Linked to:”, the module name, and the module ID. This indicates the worksheet is displaying the module data and not the xyzc1.dat data file.
Click on cell E2 containing the “MW-1” label. The bold cell border indicates that cell E2 is now the active cell.
Type a new label name, for example type BH-10 and press ENTER.
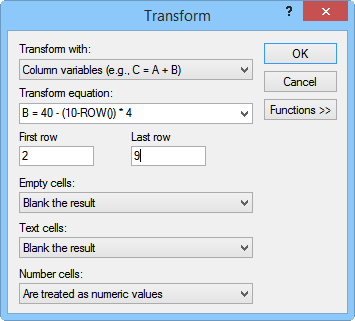
Click the Data | Transform command. The Transform dialog opens.
Change the Transform with setting to Column variables (e.g. C = A + B).
In the Transform equation field, type B = 40 - (10-ROW()) * 4.
Type 2 in the First row field and type 9 in the Last row field.
Click OK in the Transform dialog.
Now click on the Voxler1 project tab located above the Active Cell Location box.

A large number of data manipulations can be performed with the
Transform command.
Notice that the point formerly labeled “MW-1” is now labeled “BH-10” (or whatever you chose to name it). You can also see how changing the Y value for the first 8 points changed the scatterplot. Note that we changed the data for the xyzc1.dat module. The xyzc1.dat sample file is unchanged. To save a copy of changes made to linked data, click the File | Save Copy As command while viewing the data in the worksheet.
Back to Rotating Graphics