The Diamond Line symbol, shown above, is
one of the many Symbol types that can be
used by the ScatterPlot module.
The Network | Graphics Output | ScatterPlot command adds a ScatterPlot module.
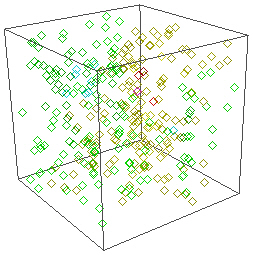
The ScatterPlot module displays a set of symbols at each point of a point set or each node of a lattice. The symbols are screen aligned and do not scale or "tilt" as the camera changes. The positions of the symbols, however, are maintained in three dimensions.
Lattice and point data are input types for the ScatterPlot module.
The ScatterPlot module creates an output geometry. It may be connected to the Graphics Output Modules. An Info Module may also be connected to the output node.
The Diamond Line symbol, shown
above, is
one of the many Symbol types that
can be
used by the ScatterPlot module.
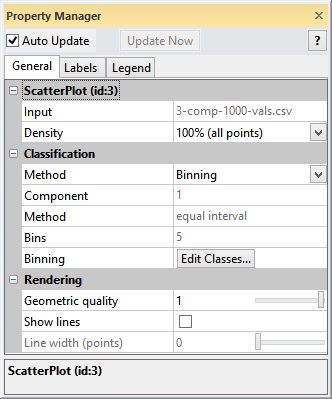
The ScatterPlot module properties are described below.
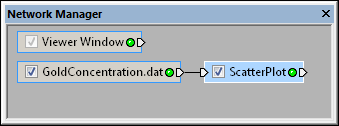
Select the ScatterPlot module
in the Network Manager
to display its properties in the Property
Manager.
The ScatterPlot module contains the following tabs in the Property Manager:
General
|
|
Customize the ScatterPlot properties in the General page of the Property Manager. |
|
The Input property shows the source to which the module is connected. This option cannot be changed in the Property Manager, but can be changed in the Network Manager by changing the module input.
The Density determines the number of points to plot as a percentage of the total number of points in the data file. Possible options are 100% (all points), 50% (every other point), 33% (every 3rd point), 25% (every 4th point), 20% (every 5th point), 10% (every 10th point), 5% (every 20th point) and 1% (every 100th point). To change the density of plotted points, click on the existing option and select the desired value from the list.
The Classification section of the General page controls the classification method and displays information about the classes when the Binning method is selected.
Select the Fixed or Binning classification method from the Method list in the Classification section. The Fixed method uses one symbol and size for the points in the scatterplot. The symbol color can be fixed, mapped by component value to a colormap, or specified by RGB color columns with the Fixed method. The Binning method separates points of the scatterplot into classes or bins. The symbol, size, and color for each bin is specified separately in the Edit Classes dialog.
The value displayed in the Component field is the component used to separate the scatterplot points into bins. Change the Component in the Edit Classes dialog. The Component property is only displayed when the classification Method is set to Binning.
The Method property displays the binning method. It is either equal interval or equal bins. Change the binning Method in the Edit Classes dialog. The binning Method property is only displayed when the classification Method is set to Binning.
The Bins property displays the number of bins. Change the number of Bins in the Edit Classes dialog. The Bins property is only displayed when the classification Method is set to Binning.
Click the Edit Classes button to specify the binning options in the Edit Classes dialog.
The Rendering section of the General page contains options for the scatterplot display. The properties displayed in the Rendering section are dependent on the classification Method.
The Geometric quality property controls the 3D quality for the 3D symbols, i.e. the 3D Cube, 3D Cone, 3D Cylinder, and 3D Sphere symbols. The Geometric quality value can be between 0 and 1. 3D symbols are rendered with higher quality and smoothness as the Geometric quality value is increased. Increasing the value also increases the relative drawing time. The Geometric quality property is only enabled when a 3D symbol is used.
Choose the type of symbol to draw at each point when the classification Method is set to Fixed. The symbol Square fast is drawn using a native OpenGL primitive and can be drawn faster than the other symbols. The Symbol list includes the following symbol types: 3D Cone, 3D Cube, 3D Cylinder, 3D Sphere, Backslash, Bar, Caution filled, Caution line, Circle filled, Circle line, Cross, Diamond filled, Diamond line, Hourglass filled, Hourglass lined, Lightning, Minus, Pine tree filled, Pine tree line, Plus, Rhombus filled, Rhombus line, Satellite filled, Satellite line, Ship filled, Ship line, Slash, Square fast, Square filled, Square line, Star, Triangle filled, Triangle line, Well, and Y . To change the symbol, click on the existing option and select the desired option in the list.
The Size controls the size
of the Symbol. The size ranges
from 0 to 1 . To change the size, highlight the existing value and type
a new value or click and drag the  to increase
or decrease the size. The larger the value, the larger the symbol appears.
to increase
or decrease the size. The larger the value, the larger the symbol appears.
Check the box next to the Show lines command to draw a connecting line between sequential points. Lines are drawn in the order that points appear in the worksheet. Line color is determined by the Color method.
The Line width (points) is
the thickness of the line that connects points. Values are in points and
range from zero to four. When the width is set to zero, the line is one
pixel wide. The larger the value, the thicker the line. To change the
value, highlight the existing value and type the desired width or click
and drag the to increase or
decrease the value.
The Color method determines the label and label line color. Options are Fixed, By colormap, and By RGB.
When set to Fixed, the Color option is available. To change the symbol color, click the current Color selection and select the desired color from the color palette. Click Other in the color palette to select or create a color in the Colors dialog.
When set to By
colormap, the symbol color is determined by the Colormap
selection. The By colormap
property is available only if the input data has at least one data
component. To change the colormap, click the current Colormap
selection and select the desired colormap from the list or click the
 button to select or edit the colormap in the
Colormap Editor.
button to select or edit the colormap in the
Colormap Editor.
When set to By RGB the symbol color is specified by columns in the data file. The Color range property specifies if the color data is 0 - 255 (byte) or 0.0 - 1.0 (double) format. Select the appropriate worksheet columns in the Red color component, Green color component, and Blue color component lists.
See Also