 button to
open the Colormap
Editor dialog.
button to
open the Colormap
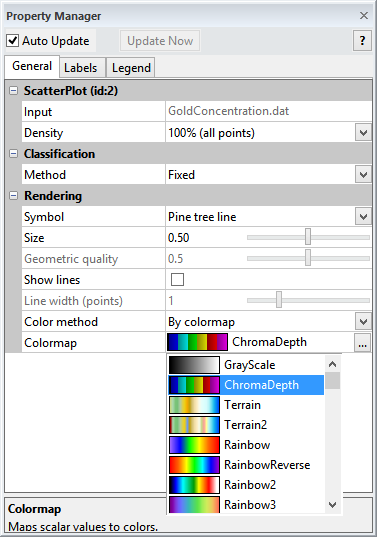
Editor dialog.The Colormap property allows you to map scalar values to color. Colormaps are often used to map color information onto one-, two-, and three-dimensional geometry. Each data value is mapped to a single color in a Colormap. This ensures the same value will always have the same color. This is a simple way to increase the information content of a visualization.
The Colormap does not display if an RGBA color lattice is used for input, as those colors are obtained directly from the lattice. The Colormap does not display if the color is a fixed color. If you expect a Colormap option and see a Color option instead, change the Color Method to By Data.
Select a predefined Colormap from the drop-down menu. The network is
automatically updated to show the new color scheme. Use the vertical scroll
bar to see all of the available predefined Colormaps. A predefined color
map can be adjusted and customized by first selecting the desired Colormap
and clicking the  button to
open the Colormap
Editor dialog.

In this example, the Colormap is used to specify
color for a ScatterPlot. Select a predefined color
combination from the Colormap drop-down list .
Click the  button to open
the Colormap
Editor dialog to create custom colors and effects. Custom Colormap
files can be loaded and saved in the Colormap
Editor dialog.
See Also