HeightFields - Advanced Suggestions
This tutorial provides suggestions when using the HeightField
module.
Two import methods are discussed in this advanced tutorial. You will
import the same grid file using both methods.
Method 1
In the first method, you will load a Surfer
grid file .GRD with a flat Z value where the gridded Z value is imported
as the C value.
Click the File
| New command to open a new Viewer
window.
Click the File
| Import command.
In the Import
dialog, select the sample grid file BoulderColorado.grd
from the Voxler 4 Samples
folder (located at: C:\Program Files\Golden Software\Voxler 4\Samples)
and click the Open button.
In the Lattice
Import Options dialog, select the Import
as uniform lattice (default) option and click OK.
Selecting this option brings the grid file into Voxler
so that the Z values are imported as zeros and the actual Z values
are assigned to the C component value, allowing for XYZC data to be
imported into Voxler.
The data module BoulderColorado.grd is displayed
in the Network Manager.
Right-click on the data module and select Graphics
Output | HeightField.
Select the BoulderColorado.grd
module in the Network Manager
to display the properties in the Property
Manager. Click the  button to see the data that was imported
into Voxler.
In the Lattice
View dialog, click the Show:
Z Coordinate on the left side. The Z values are all zeros.
Click the Show: Component 1
on the left side. The C values are the grid file Z values. In order
to properly display the elevation values, a scale factor has been
added in the HeightField
by default. Click the X button to close the Lattice
View dialog.
Select the HeightField
module in the Network Manager
to display the properties in the Property
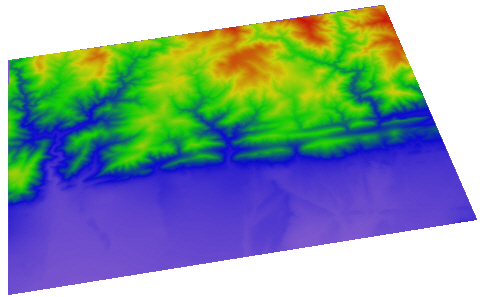
Manager. Notice that the scale is set to 0.25. Change the Scale to 0 and the grid file is
displayed as a flat surface, because the Z values are actually zeros.
Change the Colormap
to Rainbow.

Using the Import as Uniform Lattice (default)
option imports the
grid file Z values as zeros and the Z values as the component. This is
easy to see when the Scale Factor
is set to zero.
Method 2
In the second method, you will import a Surfer
grid file .GRD at correct height, add a HeightField
module, and manually adjust the HeightField
properties.
Click the File
| Import command.
In the Import
dialog, select the sample grid file BoulderColorado.grd
from the Voxler 4 Samples
folder (located at: C:\Program Files\Golden Software\Voxler 4\Samples)
and click the Open button.
In the Lattice
Import Options dialog, select the Import
as curvilinear lattice option. Check the Use
component minimum option. Click the OK
button.
The data module BoulderColorado.grd 2 is displayed
in the Network Manager. Right-click
on the data module and select Graphics
Output | HeightField.
Select the BoulderColorado.grd module in the
Network Manager to display
the properties in the Property Manager.
Click the  button to see the data that was imported into Voxler.
In the Lattice
View dialog, click the Show:
Z Coordinate on the left side. The Z values are all the Z data
values from the grid file. Click the Show:
Component 1 on the left side. The C values are the grid file
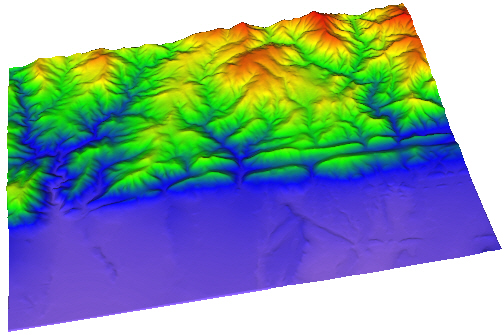
Z values. This allows the Z values to be properly display the elevation
values with no scale factor. Click the X button to close the Lattice View dialog.
Click on the HeightField
2 module in the Network
Manager. In the Property
Manager, change the Colormap
to Rainbow.

Using the Import as Curvilinear Lattice
option imports the grid file
Z values both as Z values and as the component. This is
easy to see when the Scale is
set to zero.
Back to Advanced Tutorial
Introduction
Next to Math Module
 button to see the data that was imported
into Voxler.
