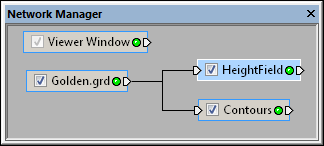
The Network | Graphics Output | HeightField command adds a HeightField module.
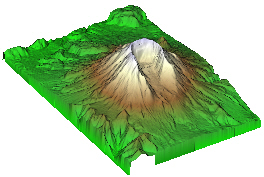
The HeightField module displays a lattice slice in three dimensions. The slice is scaled in the direction perpendicular to the lattice slice by the value of the data component specified in the lattice data import module and the HeightField scale factor. The surface is colored by mapping the data values through a Colormap, which is controlled in the Colormap Editor. The HeightField module will ignore the Surfer blanking value in the lattice (1.70141e+038). Blanked regions are not rendered.
Images can be draped over the HeightField by loading an image and connecting it as an Input Image Overlay. Vector files can be draped over the HeightField by importing the vector file and connecting it as an Input Vector Overlay. Contours can be draped over the HeightField by loading the contours from a grid file as a curvilinear lattice or as a vector overlay.
A HeightField module can be exported to different file types with the File | Save Data command, including IV, 3D DXF, and XYZC data files in the following data file formats: CSV, DAT, SLK, TXT, XLS, and XLSX.
Lattice and image are the input type for the HeightField module.
The HeightField module creates an output geometry. It may be connected to the Graphics Output Modules. An Info Module may also be connected to the output node.
|
The image on the left shows a HeightField module with a sample data set and uses the Land Colormap.
The image on the right shows a HeightField module with a data set that includes a blanked region.
The HeightField module properties are described below, followed by an example that illustrates how to use the module.
Select the HeightField module
in the Network Manager
to display its properties in the Property
Manager.
The Contours module contains the following tabs in the Property Manager:
General

Customize the HeightField properties.
The Input lattice property shows the source to which the module is connected. The Input lattice is the geometry source and defines the heights.
The Input overlay is the image source that defines the image overlay. Only 2D RGBA images can be connected to the Input overlay.
The Input component specifies which of the input components contains the data used to compute the HeightField. To change the Input component, click the current component select the desired component from the list.
Choose the direction of the HeightField slice through the volume. Choices include XY plane (axial), XZ plane (coronal), or YZ Plane (sagittal). To change the Orientation, click on the existing option and select the desired option. Choose one of the preset local axis plane normals. Axial indicates the XY plane that travels horizontally. Coronal indicates the XZ plane that travels vertically. Sagittal indicates the YZ plane that travels vertically.
|
|
|
The HeightField Orientation is set to XY plane (axial). |
The HeightField Orientation is set to XZ plane (coronal). |
The HeightField Orientation is set to YZ plane (sagittal). |
The Slice number is the index
of the slice to display. The Slice number
ranges from 1 to the maximum number of nodes in the specified direction.
The slice number resets to the middle of the volume when the Orientation
is changed. It is possible to specify an orientation so that the slice
is exactly on edge, in which case nothing is drawn. Rotate the camera slightly to see the image.
This option is not available if a single slice exists. To change the slice
displayed, highlight the existing value and type a new value or click
and drag the  to increase or
decrease the slice value.
to increase or
decrease the slice value.
Scale represents the scale
factor when computing the heights (0.0 = no height). By default, the scale
factor is set to 0.25 for a uniform lattice and 0.0 for a curvilinear
lattice. To change the scale, highlight the existing value and type a
new value or click and drag the to the
desired scale factor. The scale is any value between -1 and +1.
When importing a curvilinear lattice, it is recommended that the Scale be set to 0.0. In most cases, Surfer .GRD files will be imported into Voxler as curvilinear lattices. Curvilinear lattices have the Surfer Z value imported as both the Z and C values in Voxler. This results in excessive stretching when changing the Scale from zero.
With uniform lattices, the more the scale factor deviates from 0.0, the farther the surface projects in the perpendicular direction. The scale factor is normalized by a percentage of the volume diagonal. The scale is computed using the following equation:
scale = ScaleFromPropertiesWindow * HalfTheLatticeDiagonal / ( DataMax - DataMin)
The Draw style is the method used to display the HeightField. Available options are Shaded, Lines, and Points. To change the style, click on the existing option and select the desired option from the list. Shaded renders all polygonal geometry as shaded surfaces. Lines renders all geometry as border lines. Lines are drawn between each lattice node and those surrounding it. Points renders all geometry as vertex points. Each lattice node is displayed as a small square.
Choose the level of opacity.
This value ranges from 0.0 for completely transparent images to 1.0 for
completely opaque images. To change the opacity, highlight the existing
value and type a new value or click and drag the
to the desired value. See Transparency
Type for more information about transparency.
The HeightField is colored
by mapping the data values using the specified Colormap.
To change the colors, click on the existing colormap and select the desired
colormap from the list. Or, click on the  to set custom
colormap options. The Colormap
is not displayed if an RGBA color lattice is used for the Input
lattice since the colors are obtained directly from the lattice.
to set custom
colormap options. The Colormap
is not displayed if an RGBA color lattice is used for the Input
lattice since the colors are obtained directly from the lattice.
See Also


