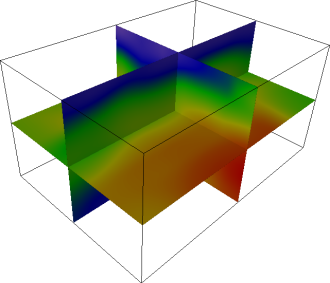
OrthoImage modules in the XY, XZ, and YZ axial
planes can be applied simultaneously to a lattice.
The Network | Graphics Output | OrthoImage command adds a OrthoImage module.
The OrthoImage module displays an orthogonal slice through a lattice parallel to one of the three axis planes ( XY, XZ, or YZ). Orthogonal indicates elements are perpendicular or at right angles. The slice is represented by mapping data to a colormap for scalar data, or as direct RGBA colors if the lattice already contains color data. The scalar to color mapping may be specified with a linear gray mapping function with contrast enhancement or with a Colormap.
Uniform lattice is the input type for the OrthoImage module.
The OrthoImage module creates an output geometry. It may be connected to the Graphics Output Modules. An Info Module may also be connected to the output node.
OrthoImage modules in the XY, XZ, and
YZ axial
planes can be applied simultaneously to a lattice.
The OrthoImage module properties are described below.
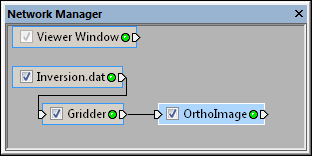
Select the OrthoImage module in
the Network Manager
to display its properties in the Property
Manager.
The OrthoImage module contains the following tabs in the Property Manager:
General

Customize the OrthoImage properties.
The Input property shows the source to which the module is connected. This option cannot be changed in the Property Manager, but can be changed in the Network Manager by changing the module input.
The Input component contains the number of the component that is being displayed as the OrthoImage. To change the component, click the current selection and select the desired component from the list.
Choose the direction of the OrthoImage slice through the volume. Choices include XY plane (axial), XZ plane (coronal), or YZ plane (sagittal). To change the Orientation, click on the existing option and select the desired option. Choose one of the preset local axis plane normals. Axial indicates the XY plane that travels horizontally. Coronal indicates the XZ plane that travels vertically. Sagittal indicates the YZ plane that travels vertically.
The Slice number is the index
of the slice to display. The Slice number
ranges from 1 to the maximum number of nodes in the specified direction.
The slice number resets to the middle of the volume when the Orientation
is changed. It is possible to specify an orientation so that the slice
is exactly on edge, in which case nothing is drawn. Rotate the camera slightly to see the image.
This option is not available if a single slice exists. To change the slice
displayed, highlight the existing value and type a new value or click
and drag the  to increase or
decrease the slice value.
to increase or
decrease the slice value.
Check the Lighting box to modulate the image colors according to the current lighting.
The Quality determines how
resolution of the OrthoImage.
This value ranges from 0.0 (lowest quality) to 1.0 (highest quality).
The lowest quality image uses near neighbor interpolation;
the higher quality images use bilinear interpolation. Note that higher
quality images take longer to render, but the appearance is
smoother in the Viewer
window. To change
the Quality, highlight the existing
value and type a new value or click and drag the
to the desired value.
Choose the level of opacity.
This value ranges from 0.0 for completely transparent images to 1.0 for
completely opaque images. To change the opacity, highlight the existing
value and type a new value or click and drag the
to the desired value.
The Mapping method appears only when the lattice contains scalar data. Lattices containing RGBA data are mapped directly and do not need this option. Available options are Linear and Colormap. To change the method, click on the existing method and select the desired method from the list.
The Linear mapping method allows specification of a linear scaling window similar to that used in medical image viewing programs. The window refers to a contiguous subset of the data specified by the Center and Width of the range. The window is linearly scaled from black at the bottom to white at the top. When the Mapping method is set to Linear, the Width and Center options become available.
The Width is the amount of
variation allowed over the entire image. This value ranges from zero to
two. A value of zero results in a sharp change in color from black to
white. A value of two results in a gradual change in color. The Center is the location of the data
window. The Center ranges from
-1 to +1. A value of zero centers the data window. Change the Width
and Center values by highlighting
the existing value and type a new value or by clicking and dragging the
to increase or decrease the
value. Changing these values enhances the contrast of various features
within the data, e.g., bone, skin.
The Colormap
mapping method applies a Colormap transfer
function to the scalar data to convert data to colors. To change the colors,
click on the existing colormap and select the desired colormap from the
list. Or, click on the  to set custom colormap options.
See Also