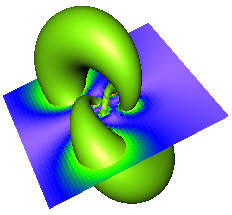
The ObliqueImage module displayed in
blue above has been added to an isosurface.
The Network | Graphics Output | ObliqueImage command adds a ObliqueImage module.
The ObliqueImage module displays a color image on a two-dimensional cutting plane through a lattice. In medical terminology, this is known as a multi-planar reconstruction ( MPR). The slice is represented by colors mapped through a Colormap for single component data, or as direct RGBA colors for lattices containing color data.
Lattice is the input type for the ObliqueImage module.
The ObliqueImage module creates an output geometry. It may be connected to the Graphics Output Modules. An Info Module may also be connected to the output node.
The ObliqueImage module displayed
in
blue above has been added to an isosurface.
The ObliqueImage module properties are described below.
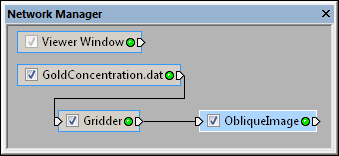
Select the ObliqueImage module
in the Network Manager
to display its properties in the Property
Manager.
The ObliqueImage module contains the following tabs in the Property Manager:
General

Customize the ObliqueImage properties.
The Input property shows the source to which the module is connected. This option cannot be changed in the Property Manager, but can be changed in the Network Manager by changing the module input.
The Input component contains the number of the component that is being displayed as the ObliqueImage. To change the component, click the current selection and select the desired component from the list.
The Resolution determines the sampling frequency to use along the cutting plane. Available options are Coarse, Medium, Fine, and Very fine. The finer the Resolution, the smoother the ObliqueImage appears in the Viewer window. To change the Resolution, click on the existing option and select the desired option from the list.
Check the box next to the Interpolate command to use trilinear interpolation to sample the lattice onto the cutting plane. If the box is not checked, then nearest neighbor interpolation is used. The trilinear interpolation often provides a more smooth image.
Check the box next to the Lighting command to modulate the image colors according to the current lighting.
Choose the level of opacity.
This value ranges from 0.0 for completely transparent images to 1.0 for
completely opaque images. To change the opacity, highlight the existing
value and type a new value or click and drag the  to the desired value.
The Mapping method appears only when the lattice contains scalar data. Lattices containing RGBA data are mapped directly and do not need this option. Available options are Linear and Colormap. To change the method, click on the existing method and select the desired method from the list.
The Linear mapping method allows specification of a linear scaling window similar to that used in medical image viewing programs. The window refers to a contiguous subset of the data specified by the Center and Width of the range. The window is linearly scaled from black at the bottom to white at the top. When the Mapping method is set to Linear, the Width and Center options become available.
The Width is the amount of
variation allowed over the entire image. This value ranges from zero to
two. A value of zero results in a sharp change in color from black to
white. A value of two results in a gradual change in color. The Center is the location of the data
window. The Center ranges from
-1 to +1. A value of zero centers the data window. Change the Width
and Center values by highlighting
the existing value and type a new value or by clicking and dragging the
to increase or decrease the
value. Changing these values enhances the contrast of various features
within the data, e.g., bone, skin.
The Colormap
mapping method applies a Colormap transfer
function to the scalar data to convert data to colors. To change the colors,
click on the existing colormap and select the desired colormap from the
list. Or, click on the  to set custom colormap options.
See Also