The Gridder module Geometry page displays the extents of the grid being created. To open the Geometry page, click on the Gridder module in the Network Manager. In the Property Manager, click on the Geometry tab.
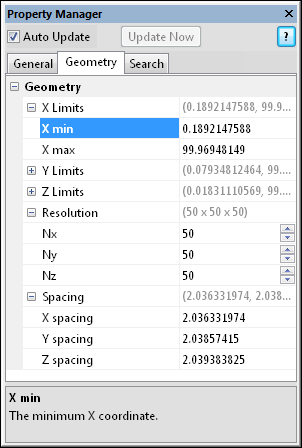
This is an example of the information displayed
in the Property Manager on the Geometry
tab for a Gridder module.
The Geometry tab contains the limits, resolution, and spacing for the lattice that is being created. Click the  next to each section name to open that section.
The X limits item displays the limits in the X direction for the lattice being created. The X min and X max coordinates define the extent of Gridder calculations and the extent of the output graphics attached to the Gridder module in the X direction. These coordinates are taken from the input data file by default; you can enter different coordinates to calculate values for a larger or smaller area. To change the value, highlight the existing value and type a new value.
The Y limits item displays the limits in the Y direction for the lattice being created. The Y min and Y max coordinates define the extent of Gridder calculations and the extent of the output graphics attached to the Gridder module in the Y direction. These coordinates are taken from the input data file by default; you can enter different coordinates to calculate values for a larger or smaller area. To change the value, highlight the existing value and type a new value.
The Z limits item displays the limits in the Z direction for the lattice being created. The Z min and Z max coordinates define the extent of Gridder calculations and the extent of the output graphics attached to the Gridder module in the Z direction. These coordinates are taken from the input data file by default; you can enter different coordinates to calculate values for a larger or smaller area. To change the value, highlight the existing value and type a new value.
Resolution is the number of nodes in the lattice. To change the number of nodes in any direction, highlight the value next to the Nx, Ny, or Nz option and type a new value or click the  to increase or decrease the number of nodes in that direction. The number of lattice nodes defaults to 50 in each of the X, Y, and Z directions.
Spacing displays the distance between grid nodes in the x, y, and z directions. When the Resolution or Limits values change, the Spacing values automatically change. To change the Spacing value, highlight the number next to X spacing, Y spacing, or Z spacing and type a new value. The Resolution will automatically update.
For some data sets, additional resolution is needed to delineate closely spaced data points, especially in the Z or depth direction.
An increase in the number of lattice nodes provides more resolution, but it also increases the amount of time needed to grid the lattice and to draw output graphics. It also increases the amount of memory needed to display graphics on-screen and to save the graphics to a .VOXB network file.
See Also