The Network | Graphics Output | BoundingBox command adds a BoundingBox module.
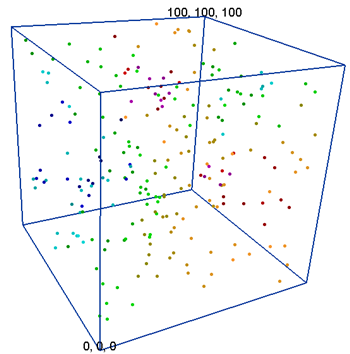
The BoundingBox module draws a bounding box around the input module extents. Additionally, labels can be displayed for the minimum and maximum corners. The labels are displayed as screen-aligned text centered on the minimum and maximum corners. The bounding box is useful to display the extent of your data.
Lattice, point data, and geometry are input types for the BoundingBox module.
The BoundingBox module creates an output geometry. It may be connected to other Graphics Output Modules. An Info Module may also be connected to the output node.
The bounding box creates a box enclosing
the entire area around the selected data.
The BoundingBox module properties are described below.
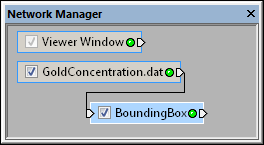
Select the BoundingBox module
in the Network Manager
to display its properties in the Property
Manager.
The Axes module contains the following tabs in the Property Manager:
General

Customize the properties of the BoundingBox.
The Input property shows the source to which the module is connected. This option cannot be changed in the Property Manager, but can be changed in the Network Manager by changing the module input.
The Lower left property shows the coordinates of the lower left corner of the bounding box. This value is for informational use only and cannot be changed.
Upper Right
The Upper right property shows the coordinates of the upper right corner of the bounding box. This value is for informational use only and cannot be changed.
The Follow data scale property determines if the bounding box is scaled by the original input data or the output from a Transform module. This property has no effect when a Transform module is not upstream of the BoundingBox module. When the Follow data scale check box is checked, the original data is used to scale the bounding box. The bounding box label values will correspond to the transformed geometry coordinates.
When the Follow data scale check box is not checked, the transformed data is used to scale the bounding box. The bounding box label values will correspond to the original data coordinates. Scaling the bounding box with the transformed data (i.e. the Follow data scale check box is NOT checked) keeps the bounding box label values and graphics outputs in the correct relative position when compared to a non-transformed graphics output.
Use the Line width (points)
option to scale the thickness of the lines in points. To change the line
thickness, highlight the existing value and type a new one, or drag the
 to the desired value. The
thickness value is relative and can be any value between 0 (1 pixel wide)
and 4.
to the desired value. The
thickness value is relative and can be any value between 0 (1 pixel wide)
and 4.
Click the existing color box next to the Color command to change the color of bounding box. The color palette opens to allow selection of a new color (or creation of a custom color). Click on the desired color or click the Other button to open the Colors dialog to set custom colors.
See Also