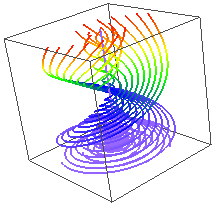
The StreamLines module uses lines,
points, or spheres to represent the data.
This example uses lines.
The Network | Graphics Output | StreamLines command adds a StreamLines module.
The StreamLines module computes streamlines through a velocity field, a distribution of velocity in a given region. Streamlines are lines within a volume of space that indicate flow direction and magnitude. The technique injects massless particles at specified seed points and traces their paths through the field. The particle stops when either the new velocity is zero, the maximum stream length is exceeded, or when the stream intersects the bounds of the field. Stream points are sampled at a constant time interval. The greater the velocity, the farther apart are the points.
This module uses a 4th order Runge-Kutta algorithm to perform the integration of the vector field. This always uses the first three components of the lattice. Any other components are ignored. If there are less than three components, a value of 0 is assumed.
Lattice is the input type for the StreamLines module.
The StreamLines module creates an output geometry. It may be connected to the Graphics Output Modules. An Info Module may also be connected to the output node.
The StreamLines module uses lines,
points, or spheres to represent the data.
This example uses lines.
The StreamLines module properties are described below.
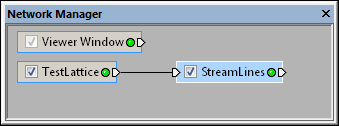
Select the StreamLines module
in the Network Manager
to display its properties in the Property
Manager.
The StreamLines module contains the following tabs in the Property Manager:
General

Customize the StreamLines properties.
The Input lattice property shows the source lattice to which the module is connected. This option cannot be changed in the Property Manager, but can be changed in the Network Manager by changing the module input.
The Input seed points property shows the source data file to which the module is connected. This option cannot be changed in the Property Manager, but can be changed in the Network Manager by changing the module input.
Check the box next to the AutoCalc step interval option to calculate the step size from the input data range. Voxler automatically chooses a reasonable value based on the input data.
The Step interval is the distance
between steps as measured along the streamline. The interval is in map
units. To change the Step interval,
highlight the existing value and type a new value or click and drag the
 to the desired value. A new
velocity vector is calculated for each step. The particle trajectory is
constructed using straight line segments. Using a smaller step size results
in more segments and a smoother trajectory. It will take additional time
and computer memory to generate the streamlines with very small values.
to the desired value. A new
velocity vector is calculated for each step. The particle trajectory is
constructed using straight line segments. Using a smaller step size results
in more segments and a smoother trajectory. It will take additional time
and computer memory to generate the streamlines with very small values.
To return to the default Step interval, check the box next to the AutoCalc step interval command.
The Number of steps determines
how long each streamline will appear. To chagne the number of steps, highlight
the existing value and type a new value or click and drag the
to the desired value. Values range between 1 and 500. The smaller
the value, the smaller the streamlines that appear.
The current streamline stops if the velocity field is less than the Minimum velocity value. To change the value, highlight the existing value and type a new value.
Choose the Direction to trace the streamline from the seed point. Options include Forward, Backward, and Both. To change the option, click on the existing option and select the desired option from the list.
The Type is the geometry used to represent the streamlines. Available options are Points, Spheres, and Lines. To change the type, click on the existing option and select the desired option from the list.
Points displays the streamlines
as individual points along the streamline path. When the Type
is set to Points, the Point
size option is available. The Point
size controls the size of the points in points. Values range from
zero to 48 points. To change the Point
size, highlight the existing value and type a new value or click
and drag the to the desired
value.
Spheres displays the streamlines
as individual three dimensional spheres along the streamline path. Setting
the Type to Spheres
results in longer time needed to render the StreamLines
than the other types. When the Type
is set to Spheres, the Sphere size and Sphere
quality options are available. The Sphere
size controls the size of the spheres. Values range between zero
and one. When set to zero, no spheres are displayed. The Sphere
quality option changes the display of the spheres. Values range
between zero and one. When set to zero, spheres are of lesser quality,
but redraw faster. When set to one, spheres redraw slowly, but have high
quality appearance. To change either the Sphere
size or Sphere quality,
highlight the existing value and type a new value or click and drag the
to the desired value.
Lines displays the streamlines
as lines. When the Type is set
to Lines, the Line
width (points) option is available. The Line
width (points) controls the thickness of the line, in points. Values
range between zero and four. To change the line width, highlight the existing
value and type a new value or click and drag the
to the desired value.
The Color method property controls the color of the streamline. Available options are Fixed and Magnitude. Fixed uses a single fixed Color for all streamlines. Magnitude calculates the magnitude of the velocity field and converts it to a color using the associated Colormap. To change the method, click on the existing option and select the desired option from the list.
The Color section specifies the fixed color. To change the color, click the colored box and choose a new color from the color palette. If the basic colors in the palette do not meet your needs, click Other to create a custom color.
The Colormap property maps
the vector magnitude to color. Click the bar next to Colormap
to display the default color combinations. Click the  button to launch the Colormap Editor
dialog.
button to launch the Colormap Editor
dialog.
The Streamlines module requires an input lattice with one, two, or three components. For a three-component data file, attach three Gridder modules to the data module output and grid each component separately. Combine them into a single three-component lattice with a Math module and attach the output from the math module to the input of the streamlines module. Or, import a three component lattice instead of a data file.
See Also