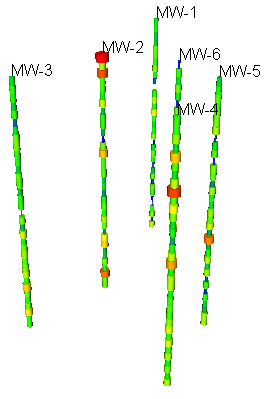
Display wells with variable width
and color to highlight areas of interest.
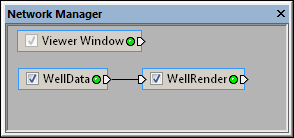
The Network | Graphics Output | WellRender command adds a WellRender module. The WellRender module displays well traces along the well path generated from well data. Wells are displayed as tubes. Thickness and color can vary down the well. In addition, direction data and interval data can be displayed on the well.
In order for well traces to be displayed, the WellData module needs to contain valid well paths. For a well to have a valid path, one of the following needs to be true:
The data is imported with azimuth, dip, and measured depth.
The data is imported with directional survey information. A path is then computed on the Well Paths tab.
The data is imported with pre-computed X, Y, and Z values positioned along the well path.
Well data is the input type for the WellRender module.
The WellRender module creates an output geometry. It may be connected to the Graphics Output Modules. An Info Module may also be connected to the output node.
Display wells with variable width
and color to highlight areas of interest.
The WellRender module properties are described below.
Select the WellRender module in
the Network Manager
to display its properties in the Property
Manager.
The WellRender module contains the following tabs in the Property Manager:
General

Customize the WellRender properties.
The Input property shows the source well data to which the module is connected. This option cannot be changed in the Property Manager, but can be changed in the Network Manager by changing the module input.
The Wells section contains
a list of all wells that are displayed by the WellRender.
Click on the  to expand the Wells section.
To add a well to the list, click the File
| Import command and add new well data to the existing WellData
module. To turn off the display of a well in the list, uncheck the box
next to the well name. To display a well, check the box next to the well
name.
to expand the Wells section.
To add a well to the list, click the File
| Import command and add new well data to the existing WellData
module. To turn off the display of a well in the list, uncheck the box
next to the well name. To display a well, check the box next to the well
name.
To delete a well permanently from the project, click on the WellData module. Right-click on the input file in the Property Manager and select Delete [file name] from the context menu. To hide a well, uncheck the well name on the General tab for the WellRender module.
The Labels section contains
options for displaying labels for the well names. Click on the to
expand the section and set label properties.
Check the box next to Show labels to display well names. The well names are imported with the WellData. Well names are always shown parallel to the view on the screen.
The Font option sets the font used for writing the labels. All available TrueType fonts are listed as options. To change the font, click the current font name and select the desired font name from the list.
The Size (points) option sets
the size of the labels in points. Values range from 4 to 288 points. The
larger the value, the larger the text appears on the screen. To change
the value, highlight the existing value and type a new value or click
and drag the  to the desired
size.
to the desired
size.
The Color option specifies the text color. To change the color, click the colored box and choose a new color from the color palette. If the basic colors in the palette do not meet your needs, click Other to create a custom color. The label line is drawn to match the color of the label.
Choose Left, Right, or Center justification for the label. The Justification is relative to the three-dimensional anchor point. Left anchors the left edge of the text to the anchor point, Right anchors the right edge of the text to the anchor point, and Center anchors the middle of the text to the anchor point.
The X offset moves the screen
position of the label away from the symbol along the X axis. Values are
in pixels and range from -100 pixels to +100 pixels. From the top view
for example, a negative value moves the label to the left, and a positive
value moves the label to the right. The label stays aligned with the screen
regardless of how it is moved. To change the offset, highlight the existing
value and type a new value or click and drag the
to the desired value.
The Y offset moves the screen
position of the label away from the symbol along the Y axis. Values are
in pixels and range from -100 pixels to +100 pixels. From the top view
for example, a negative value moves the label below the symbol, and a
positive value moves the label above the symbol. The label stays aligned
with the screen regardless of how it is moved. To change the offset, highlight
the existing value and type a new value or click and drag the
to the desired value.
The Z offset moves the screen
position of the label away from the symbol along the Z axis. Values are
in pixels and range from -100 pixels to +100 pixels. From the top view
for example, a negative value moves the label behind the symbol, and a
positive value moves the label in front of the symbol. The label stays
aligned with the screen regardless of how it is moved. To change the offset,
highlight the existing value and type a new value or click and drag the
to the desired value.
Check the box next to the Show leader lines option to display lines connecting the label and the top of the well.
Use the Leader line width (points)
option to scale the thickness of the line that connects the well to the
label. Values are in points and range from zero to four. To change the
line thickness, highlight the existing value and type a new one, or drag
the to the desired value.
See Also