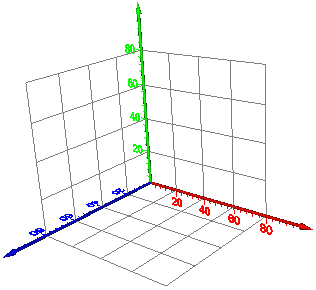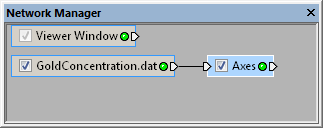
Add a grid to your axes in the Axes section
of the Property Manager.
The Network | Graphics Output | Axes command adds an Axes module.
The Axes module creates a set of axes. The axes are attached to an input point set or lattice. The axis labels are planar by default, although the orientation of the plane can be changed in the Property Manager. A grid can also be displayed between any two axes. By default, the X axis is red, the Y axis is green, and the Z axis is blue. The colors of the axes can be changed in the Property Manager for the existing axes or in the Tools | Options dialog for default conditions for future axes.
Lattice and point data are input types for the Axes module.
The Axes module creates an output geometry. It may be connected to other Graphics Output Modules. An Info Module may also be connected to the output node.

Add a grid to your axes in the Axes
section
of the Property
Manager.
The Axes module properties are described below.

Select the Axes module in the Network
Manager
to display its properties in the Property
Manager.
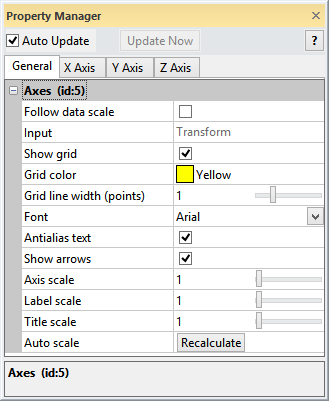
The Axes module contains the following tabs in the Property Manager:
General

Change the axes general properties to fit your needs.
Any changes made to these options automatically apply to the X, Y, and Z axes.
The Follow data scale property determines if the axes are scaled by the original input data or the output from a Transform module. This property has no effect when a Transform module is not upstream of the Axes module. When the Follow data scale check box is checked, the original data is used to scale the axes. The axis values and labels will correspond to the transformed geometry coordinates.
When the Follow data scale check box is not checked, the transformed data is used to scale the axes. The axis values and labels will correspond to the original data coordinates. Scaling the axis with the transformed data (i.e. the Follow data scale check box is NOT checked) keeps the axes and graphics outputs in the correct relative position when compared to a non-transformed graphics output.
It is generally necessary to adjust the axis scales, increments, and label settings after changing the Follow data scale state. You can manually change these settings on the X Axis, Y Axis, and Z Axis pages of the Property Manager. Alternatively, it is recommended that you click the Recalculate button in the Auto scale field after checking or unchecking the Follow data scale check box.
The following images highlight the difference between the Follow data scale property states. The original Y data range is 0 to 350, and the transformed Y data range is -3325 to 3675.
|
|
In this image the Dissolved Solids (VolRender).voxb sample file has been modified with the Follow data scale check box checked. |
This image shows the Dissolved Solids (VolRender).voxb sample file with the Follow data scale check box not checked. |
The Input property shows the source to which the module is connected. This option cannot be changed in the Property Manager, but can be changed in the Network Manager by changing the module input.
Check the box next to the Show grid command to show the grid lines between the axes. Uncheck the box to turn off the display of the grid. The grid lines are drawn at the label locations.
Click the existing color box next to the Grid color command to change the color of the grid lines. The color palette opens to allow selection of a new color (or creation of a custom color). Click on the desired color or click the Other button to open the Colors dialog to set custom colors.
The Grid line width (points)
is the thickness of the grid lines (in points). To change the line width,
highlight the existing value and type a new value or drag the  to increase or decrease the line width. A line width of zero is equal
to one pixel. The Grid line width (points)
values vary between zero and 4.
The Font command specifies the font that the axis text uses. To change the font, click the current font and choose a new font from the drop down menu.
Check the box next to the Antialias text option to make the fonts appear smoother by slightly adjusting the colors. This usually makes the text appear somewhat more dim.
Check the box next to the Show arrows command to show the three-dimensional arrows at the end of the axes. Uncheck the box to turn off the display of the arrows.
Use the Axis scale option to
scale the axis thickness. To change the thickness of the axis, highlight
the existing value and type a new value, or drag the  to the desired value. The nominal thickness is defined as a fraction of
the bounding box diagonal. When
the axis thickness is set to 0, the main axis shaft is drawn as a single
line. A thickness greater than 0 draws the axis as a 3D cylinder.
The Label scale command changes
the label size. To change the label size, highlight the existing value
and type a new value, or drag the  to the
desired value.
The Title scale command changes
the title size. To change the title font size, highlight the existing
value and type a new value, or drag the  to the desired
value.
Click the Recalculate button next to the Auto scale command to recalculate data-dependent default values for the current data set. This is useful when the input data has changed and you wish to rescale the axes to fit the data, or if manual scaling has resulted in axes that are not visible. This function replaces any user-specified axis scaling parameters.
See Also