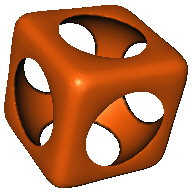
The sample TestLattice wiffle ball
with an Isosurface module.
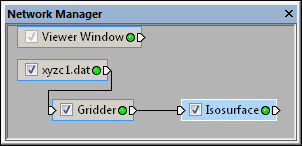
The Network | Graphics Output | Isosurface command adds a Isosurface module.
The Isosurface module creates an isosurface through an input lattice. An isosurface is a surface of constant value in a three-dimensional volume. The isosurface value is set in the Isovalue property in the Property Manager. The isosurface separates regions less than the selected isovalue from regions greater than the selected isovalue. All points on the isosurface have the same value (the isovalue).
This module provides a very quick method for reconstructing polygonal surface models from a lattice. The algorithm computes lattice cell interactions and combines them into triangle meshes for rendering.
An Isosurface module can be exported to different file types with the File | Save Data command, including IV, 3D DXF, and XYZC data files in the following data file formats: CSV, DAT, SLK, TXT, XLS, and XLSX. Note the component value is the same for every point in the isosurface, and is the Isovalue specified in the Property Manager.
3D lattice is the input type for the Isosurface module.
The Isosurface module creates an output geometry. It may be connected to the Graphics Output Modules. An Info Module may also be connected to the output node.
The sample TestLattice wiffle
ball
with an Isosurface module.
The Isosurface module properties are described below.
Select the Isosurface module in the Network
Manager
to display its properties in the Property
Manager.
The Isosurface module contains the following tabs in the Property Manager:
General

Customize the Isosurface properties.
The Input property shows the source to which the module is connected. This option cannot be changed in the Property Manager, but can be changed in the Network Manager by changing the module input.
The Input component specifies which of the input components contains the data used to compute the isosurface. To change the Input component, click the current selection and select the desired component from the list.
The threshold value of the surface to generate. The generated surface
separates data less than this value from data greater than this value.
To change the Isovalue, highlight
the existing value and type a new value or click and drag the  to increase or decrease the value. The image in the Viewer
window updates as the value changes.
to increase or decrease the value. The image in the Viewer
window updates as the value changes.
Check the box next to Compute volume to calculate the volume displayed by all enclosed areas of the Isosurface. The volume greater than the isosurface is displayed next to the Volume >= isovalue option. Only areas with isosurface values greater than the isovalue are included in this calculation. Areas with values less than the isovalue are shown in the Volume<=isovalue option.
Volume calculations are generated from all voxels either partially or fully included in the isosurface. A voxel is fully contained if all of the eight corner lattice points have a component value greater than or equal to the Isovalue. A voxel is partially contained if one or more corner lattice points have a component value greater than or equal to the Isovalue. The total Volume >= isovalue is the sum of the individual volumes from these voxels. Results are provided in cubic units based on the units of the input grid file. To make volumetric sense, the X, Y, and Z units should be the same.
To increase accuracy in the volume calculations, increase the lattice resolution by regridding the data or increase the number of cells in the X, Y, and Z directions (Nx, Ny, and Nz) or Gridder.
Leaving the Compute volume box checked can result in an increase in the time needed to redraw the Isosurface. It is recommend that the box next to Compute volume be left unchecked unless the volume calculation is needed.
The Draw style is the style that is used to draw the isosurface in the Viewer window. Available options are Shaded, Lines, and Points. To change the value, click on the existing option and select the desired option from the list. Choose Shaded to render all polygonal geometry as shaded surfaces. Choose Lines to render all geometry as a wireframe connection of border lines. Choose Points to render all geometry as vertex points.
the Side(s) to Draw controls which portion of the isosurface is visible. Available options are Front and back, Front only, and Back only. To change the value, click on the existing option and select the desired option from the list. Choose Front and back to draw both the front and back of the isosurface. When Draw style is set to Lines or Points, the resulting image may be difficult to determine which values are in the front or back., Front only, and Back only draws only a single side of the isosurface. The side drawn is relative to the camera's current position. The closer side is the Front and the side furthest from the camera is Back.
The method used to generate the surface colors. The color of the isosurface may be set to a Fixed color or to By isovalue, which matches a colormap with the Isovalue. Mapping the Isovalue through a Colormap can be useful when displaying multiple isosurfaces. To change the Color method, click on the existing option and select the desired option from the list.
When set to Fixed, the Color option becomes available. The Color is the color of the isosurface. To change the color, click on the existing color and select the desired color from the list. Alternatively, click the Other box to open the Colors dialog, where you can set custom colors.
When the Color method is set
to By isovalue, the Colormap
option becomes available. To change the colormap used by the isosurface,
click the existing color bar to the right of the Colormap
command to select a different colormap from the list. Click on the desired
colormap and the isosurface updates. Alternatively, click the  button to open the Colormap Editor dialog.
The Colormap Editor dialog allows
you to create a custom colormap and to change the mapping of color to
data values.
button to open the Colormap Editor dialog.
The Colormap Editor dialog allows
you to create a custom colormap and to change the mapping of color to
data values.
Click the  next to Material to open the
material options settings. The Material
options control the color, intensity, shininess, and opacity
of specular highlights, which are bright spots of light that appear on
illuminated objects.
next to Material to open the
material options settings. The Material
options control the color, intensity, shininess, and opacity
of specular highlights, which are bright spots of light that appear on
illuminated objects.
Specular color and Specular intensity control the amount of directional light reflected off of the surface. "Specular" refers to light coming from a particular direction and bouncing off of the surface in a preferred direction. A shiny surface such as metal has a high specular component whereas a surface like carpet has almost no specular component. Increasing the specular intensity results in strong shadow effects and more pronounced "shiny" or glare spots.
Specular color details the color of specular highlights. This helps control the amount of directional light reflected off the surface. To change the color, click on the existing color and select the desired color from the list. Alternatively, click the Other box to open the Colors dialog, where you can set custom colors. White is the default Specular color.
Specular intensity is the intensity
of specular highlights. This also helps control the amount of directional
light reflected off the surface. The value ranges from 0.0 (none) to 1.0
(full intensity). To change the value, highlight the existing value and
type a new value or click and drag the
to increase or decrease the light intensity.
Shininess controls the size
and brightness of specular highlights. The larger the value, the smaller
and brighter (more focused) the highlight. The value ranges from 0.0 (dull,
diffuse surface) to 1.0 (highly polished surface). To change the shininess,
highlight the existing value and type a new value or click and drag the
to increase or decrease the
value.
The opacity of the surface
is a combined function of the opacity settings in the Colormap
and the material Opacity value.
The Opacity value combines with
the alpha value in the Colormap
to determine the transparency
of the surface. Values range from 0.0 (completely transparent) to 1.0
(completely opaque). To change the opacity, highlight the existing value
and type a new value or click and drag the to increase
or decrease the value.
See Also